Google Analytics (GA) is an excellent tool for analyzing your website traffic, performance, and other key metrics. However, it's not the most intuitive, or user-friendly software when you first dive into it. In this blog, we're going to explore one of the more common and essential reports in GA the Audience Overview. This isn't going to get super technical or full of jargon, it's designed to be a straightforward explanation of the elements you'll see in the audience overview section. This article assumes you already have Google Analytics installed on your site, if not, you may want to contact us to help with that.
Why Should I Care?
So let's get this out of the way first. Having a handle on your audience is essential for many reasons, but most importantly it's an indicator of how well your SEO is doing. Are you only seeing double or triple digit traffic in a month? If so that's going to be tough to generate the number of leads you're looking for. Understanding how many people visit your site is the first step in developing more leads.
Understanding the Audience Overview Screen
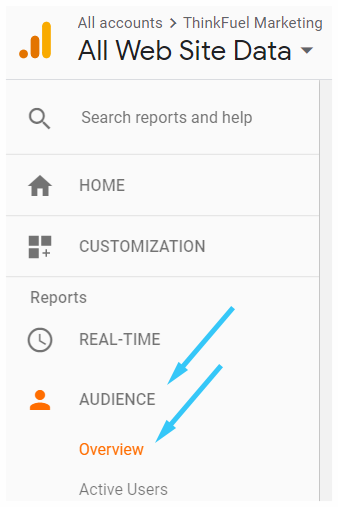
When you log into your GA account, you will be brought to the homepage report. To access the Audience Overview screen, just click on Audience > Overview on the left side menu.
Once there you will see a screen like the one below. For the purposes of this blog, we're only going to focus on the eight core metrics at the bottom of this screenshot.
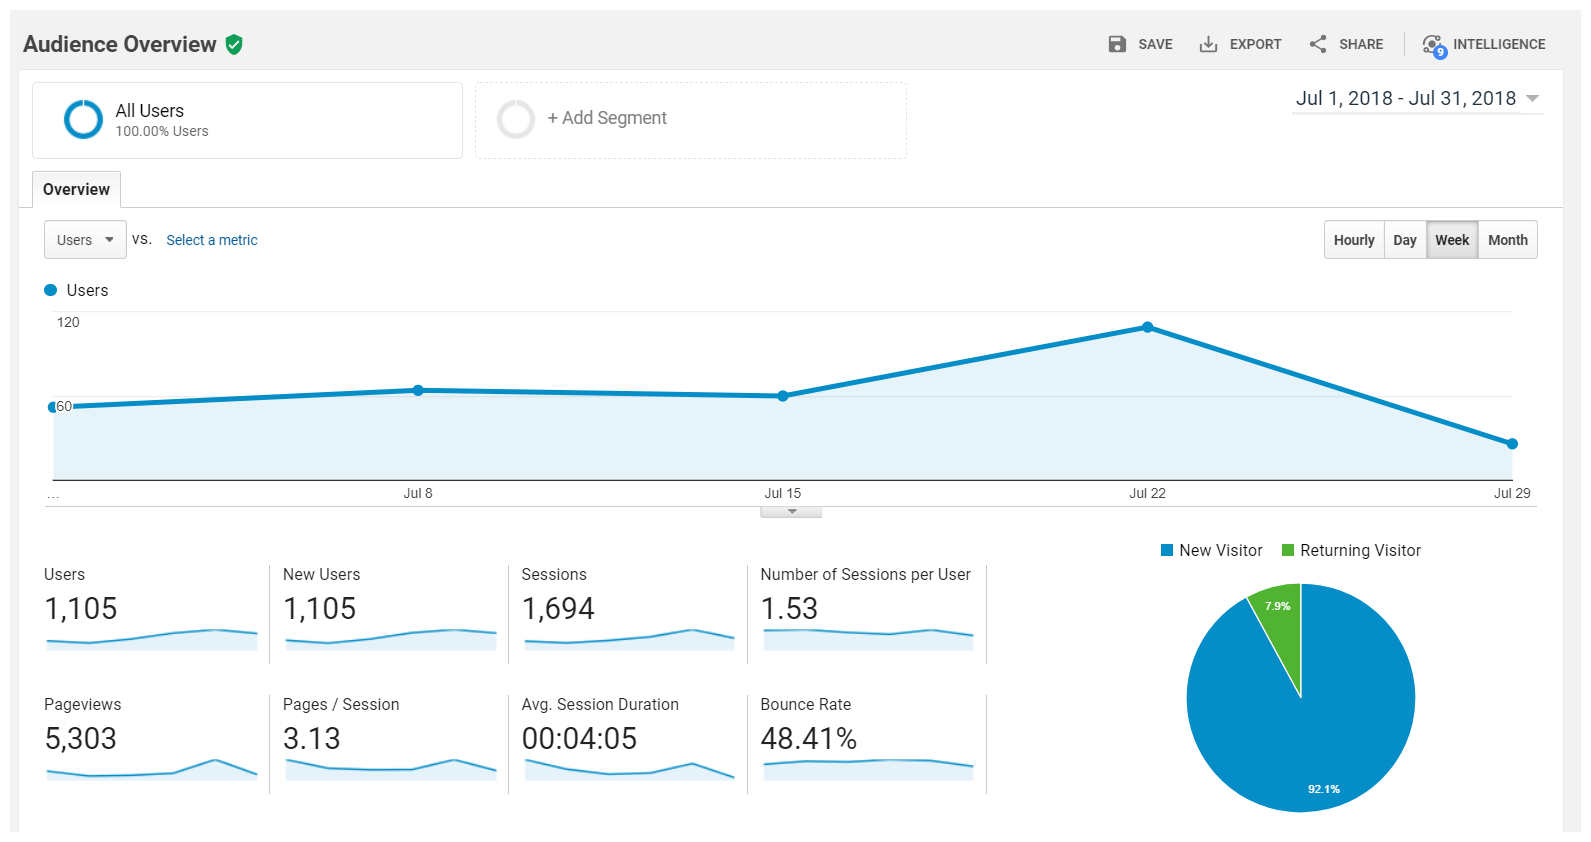
In the example above we have eight different metrics for our site. These measurements relate to the date range you specify in the date picker at the top right of the screen. Let's break down these eight elements in easy to understand terms.
Users: This is the total number of different people visiting your site.
New Users: This is the total number of people seeing your site for the first time.
Sessions: This is the total number of visits to your site, this is different than the number of Users (and will always be higher) because it users will often revisit your site multiple times.
Number of Sessions per Users: As mentioned above, users will typically visit your site more than once, this number represents the average number of times a user visited your site.
Pageviews: This is the total number of pages that were viewed on your site by all users.
Pages / Session: How many pages the average user looks at before leaving your site.
Average Session Duration: How long the average visit to your site is.
Bounce Rate: This is the percentage of visitors that landed on a page on your site and left without looking at a second page. Bounces are considered "bad" by most people, but that's not always the case. If someone is looking for your phone number and finds it on the first page the visit, that would be considered a bounce, but it's not really a "bad" thing.
As I mentioned earlier, it's important to understand the volume and tenancies of people visiting your website when developing your lead generation metrics. If you want 30 new leads a month, but you only have 50 people visiting your site, that's not a realistic goal. If you're in the B2B technology sector, you should be aiming for a conversion rate 2-3%; meaning, 2-3% of the Users value should be coming through as leads.

Share this

How to Optimize Your Website Images for SEO

9 Reasons Paid Search is Critical to a Well-Rounded Marketing Campaign